

Why I Do This Every Single Week
Before any trade gets taken, before any idea gets shared in the room, there is the research. Every week I go name by name through the market and build out a complete map for each one: where it sits structurally, what setup is forming, the exact condition that would trigger me in, the precise level that proves me wrong, and the targets I’m playing for. This week that process produced 18 fully mapped ideas — longs, shorts, and updates on positions I’m already tracking.
Here’s why that matters to you. Last month we posted over a 51% return — and I want to be very clear about where that came from. It did not come from gut feel, hot tips, or luck. It came from this — the exact research you’re about to see a piece of. Every winning idea last month started its life as a row in a sheet just like this one: a name, a context, a trigger, a stop, a target. The 51% is the outcome. The weekly research is the engine that produced it.
So today I want to pull back the curtain, show you how the process actually works on a couple of names, and walk through what I’m watching heading into the week.
Let me show you exactly what one of these looks like, start to finish, so you understand the depth here.
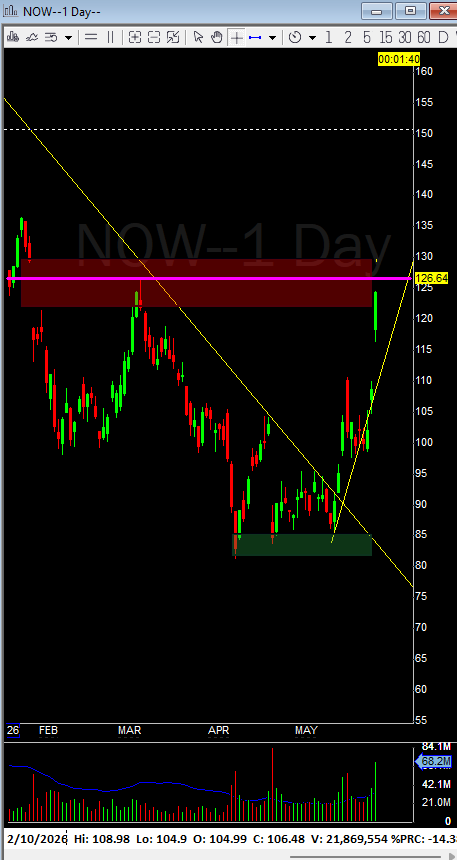
Take NOW (ServiceNow). The context: this is a stock that broke a major daily downtrend, falling all the way from $180 down to $80 before finding its footing and beginning to recover. It’s now testing a meaningful supply zone in the $126–130 area, and importantly, the move is tailwind-dependent — it needs the broader market behind it. The $114–115 area is the 60-minute breakout reference that defines the lower structure.
The idea: I want to see NOW hold above $130 for a session or two, or pull back into the $126–128 zone and hold there. The confirmation that gets me interested is price holding $130, pulling back into $126–128, and reclaiming — at which point the targets become $140–145, then $150–155. The invalidation is clean and pre-defined: if it traps longs at supply and fails below $126 — specifically if it rejects $128–130 and loses $122–123 — the trade is off, and the downside path opens toward $114–115, then $108–110.
That is one name. Notice what’s there: context, a clear long thesis, a specific trigger, a defined invalidation, and layered targets. Every one of the 18 names this week is mapped to exactly this level of detail. That is the difference between trading and gambling
A Second Sample — A Short, Mapped the Same Way (INTC)
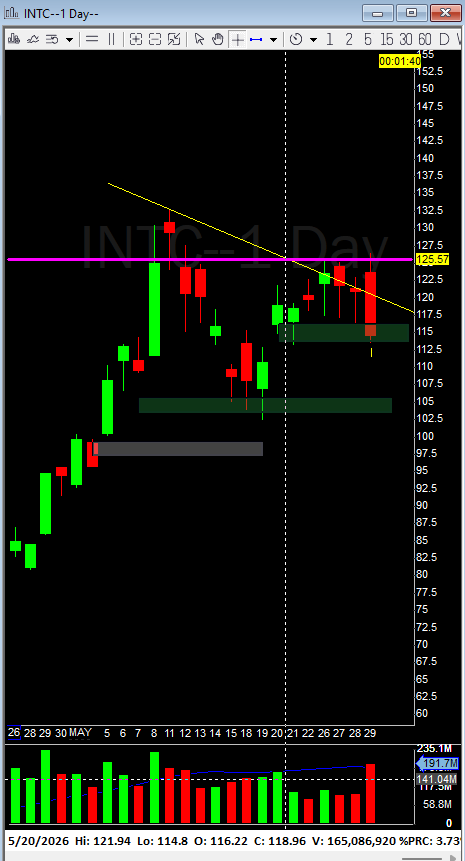
People assume research like this is only about finding longs. It isn’t. INTC (Intel) is this week’s highest-conviction short idea in the semiconductor group, and it’s mapped with the same rigor.
The context: Intel put in a failed breakout at $125.57. On the 60-minute chart it’s carving a descending wedge with lower highs — a classic weakening structure. And critically, it’s sector-correlated: if the strong names in the group lose their footing, INTC tends to follow fast and hard. The flip side — what would invalidate the short — is a clean reclaim of $125.57 with volume, which would put the bullish case back in play toward $130–135.
That’s the kind of two-sided thinking that protects an account. I don’t just look for what I want to happen — I define exactly what would prove me wrong before I ever take the trade
What Else Is On the List This Week
Those are two of the eighteen. Here’s a taste of what else I mapped — the names, the stories, and why they’re on my radar. The specific triggers, stops, and targets for these are in the full members’ research:
The semiconductor complex is the center of gravity right now. MU (Micron) is what I’ve flagged as the cleanest risk in the entire group — a textbook breakout setup with the tightest, best-defined structure of any name this week. AMD is pressing into all-time-high territory with a breakout over $500 in play. SNDK and QCOM are riding the same sector breakout, and ARM is digesting a vertical move that ran from $232 to $355. When an entire sector moves together like this, the correlation is both the opportunity and the risk — and knowing how to position around it is everything.
Beyond the semis: META is on a runaway gap — a genuine strength signal — with a weekly target up at $736.80 as long as it holds its key level. IBM has gone parabolic off a major demand zone and is pressing into supply. MSFT triggered and is now working through a major gap zone. NFLX, ANET, BA, and UBER are all updates on positions already in motion, several of which have already hit their first targets. SHOP, HOOD, and COIN round out the list with their own distinct setups — including HOOD’s sell-the-news risk around June 4, and COIN’s range that has already produced two failed breakouts (and one honest, documented loss — because real research tracks the misses too).
This Is the Product — and It’s How You Get Better
I’ll be straight with you. The reason I share this is not just to show off a watchlist. It’s because seeing the process repeated, week after week, is how a developing trader actually internalizes it. You start to see how context leads to a thesis, how a thesis becomes a trigger, how every idea has a pre-defined exit before a dollar is risked. That repetition is the education.
The full research — all 18 names with every trigger, every stop, every target, updated continuously and walked through live in the room — is what members get. If you want to trade alongside this process instead of guessing, that’s the invitation.
How To Access
Eighteen names, one repeatable process, zero guessing. That’s the whole philosophy in a sentence. The market gives opportunities every single week to the trader who has done the work to recognize them. The research is how you do the work.
Want the full weekly research with every level, plus live updates and the room where we trade it together? Subscribe and join us below.